GPS comparison tests
For an introduction, see also GPS.
Below are screenshots taken on September 29, 2024, during a walk in the park. In one hand, I held an iPhone 14 (with dual-band GPS), and in the other, an iPhone 12 (without dual-band GPS).
For testing purposes, the OpenBomenKaart application uses diagnostic tweaks, as shown in the screenshots.
The exact path I walked is marked in cyan. I traced this route on the desktop using Esri imagery via tool keene.edu/campus/maps/tool/. I consider this my reference track. Note that Esri and OSM may not always align perfectly, especially for paths in the park.
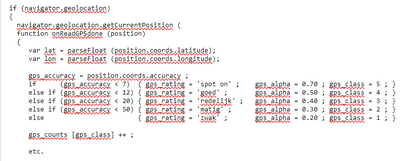
Every second, GPS coordinates are recorded along with an accuracy value. I translate the accuracy into a rating scale from 1 to 5 ('weak' to 'spot on'). See the code example below.
Every second I show the measured position as a magenta circle. Every time the signal strength changes a full level I plot a yellow circle, and the strength. I connect the dots with a red line.
In the live app the circles work best at zoom 19 or higher. The red line works best at zoom 18 or lower.
Evaluation: both iPhones are able to render the route followed reasonably precise, zoomed out, that is. However on closer inspection (zoomed in) the discrepancy can be confusing. The exact position can be 10 meters or more from what is reported. During normal use this can be mitigated by waiting until the blue dot stabilizes, same as with Google Maps. However in a unstructured area, say a park, it may be not so easy to detect a discrepancy using visual cues. We actually need a higher precision than Google Maps need (if in Google Maps the blue dot is a few meters outside a bicycle lane, no-one will get confused).
